Response View
The response of Scan, Query and PartiQL query operations is displayed in Table, JSON or DynamoDB JSON views with additional action toolbar. The response of other operations is displayed in JSON view.
View modes
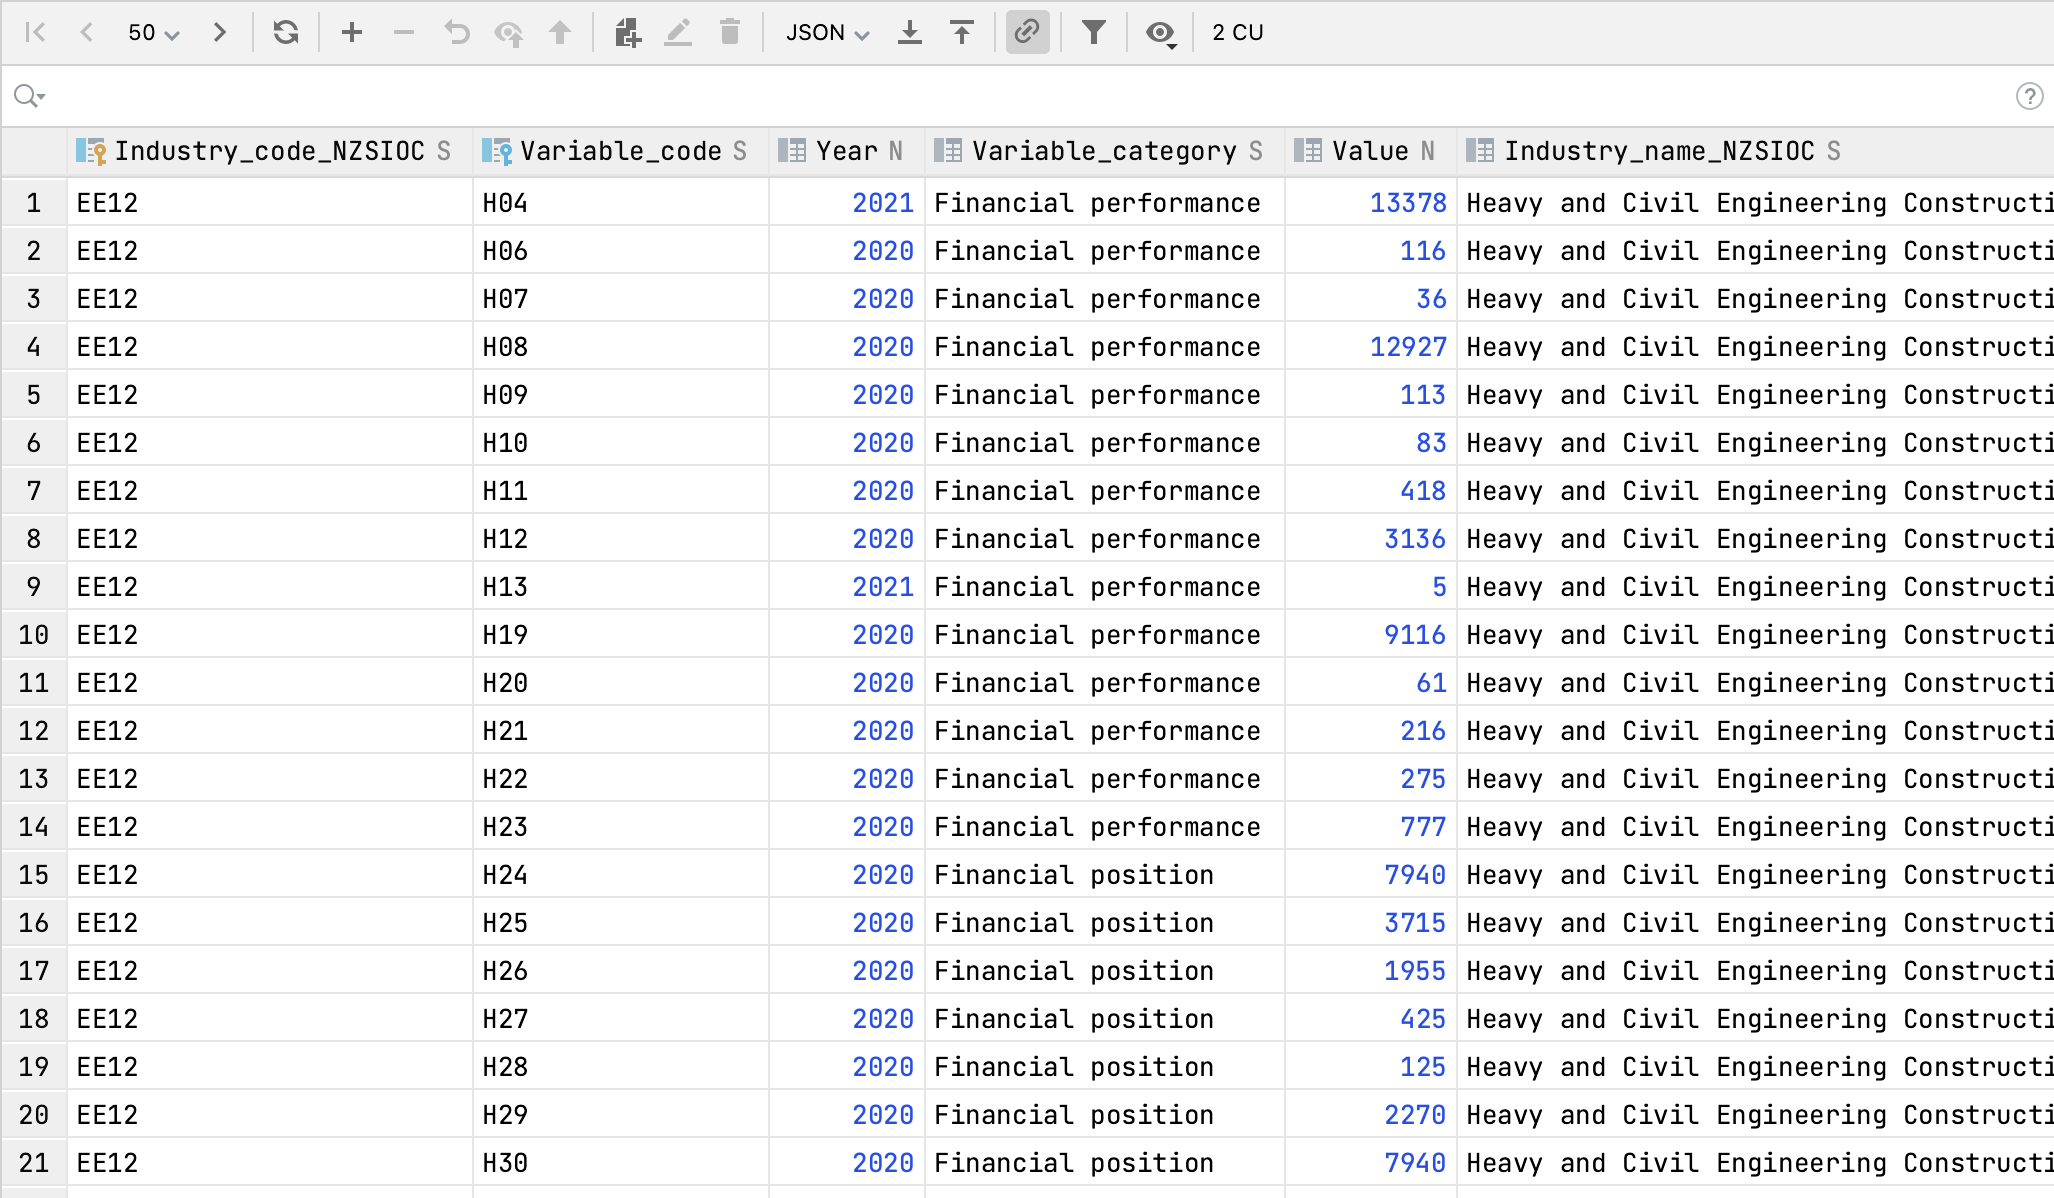
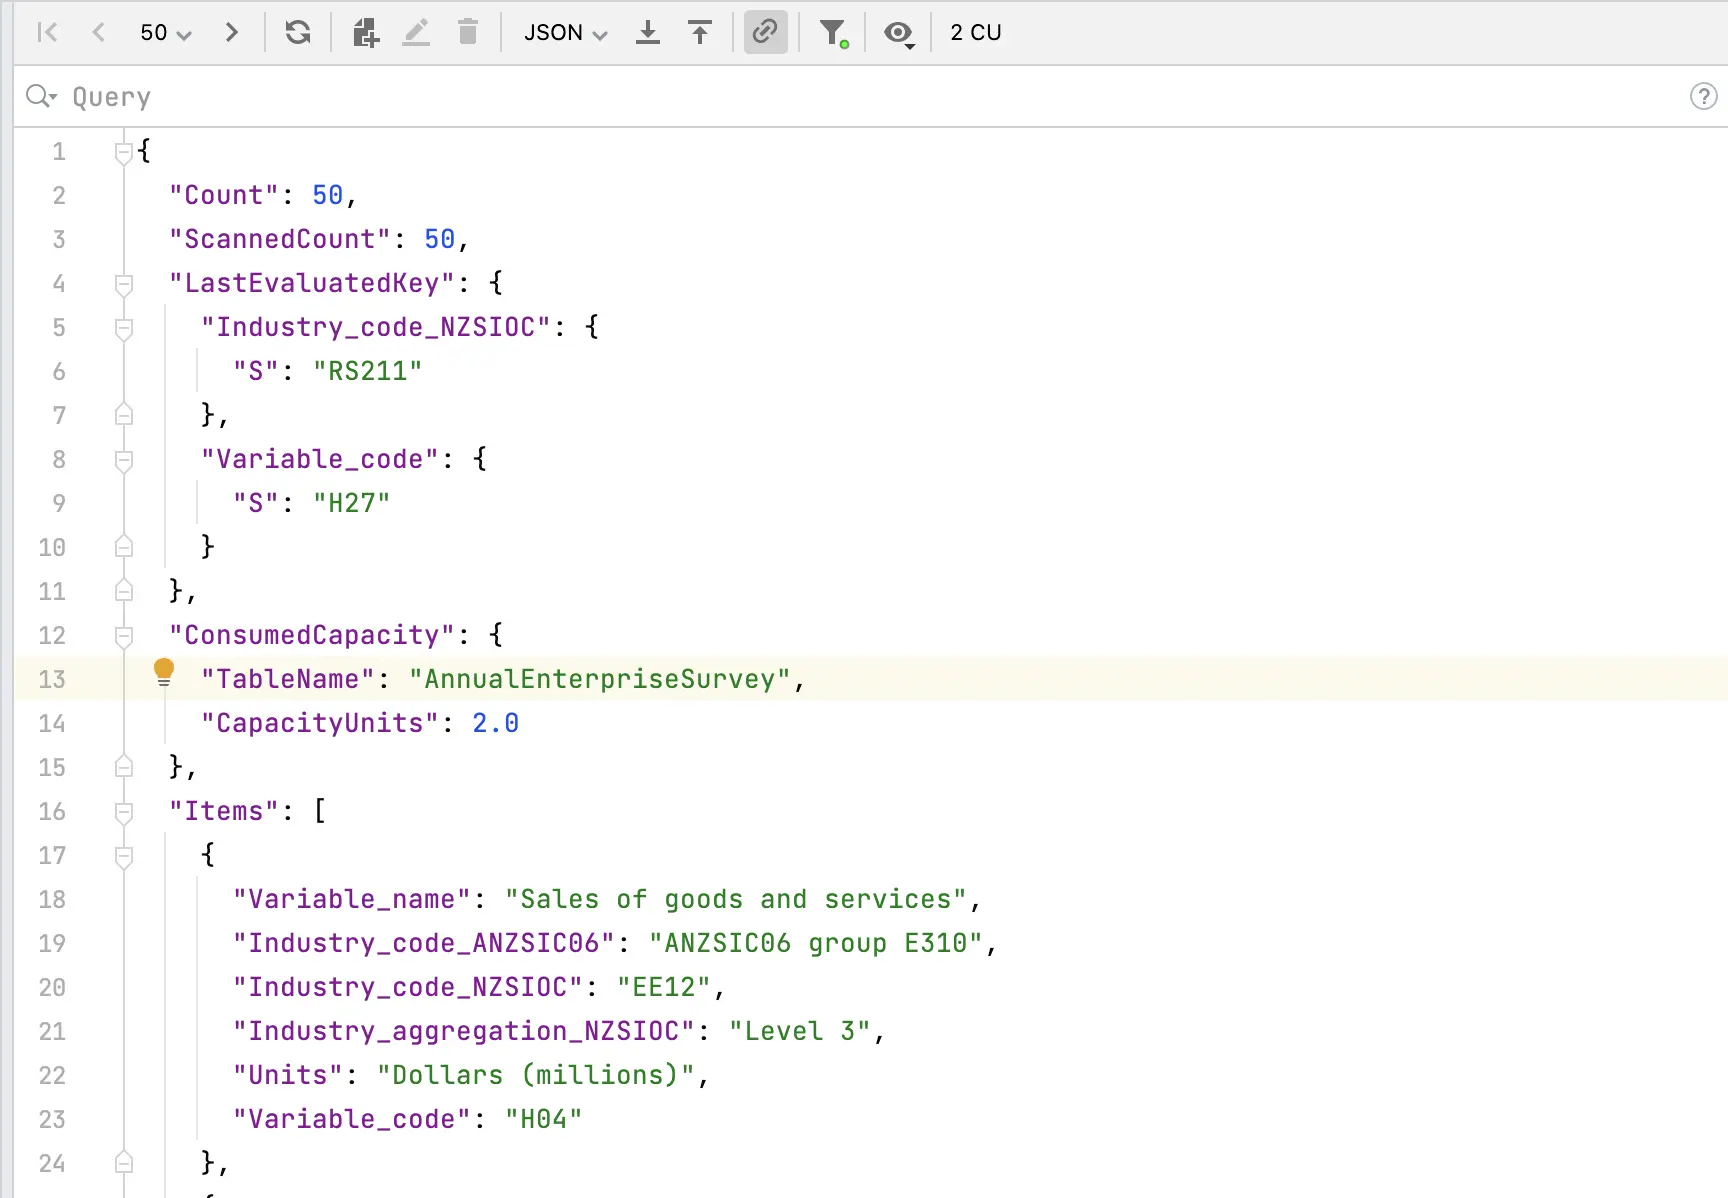
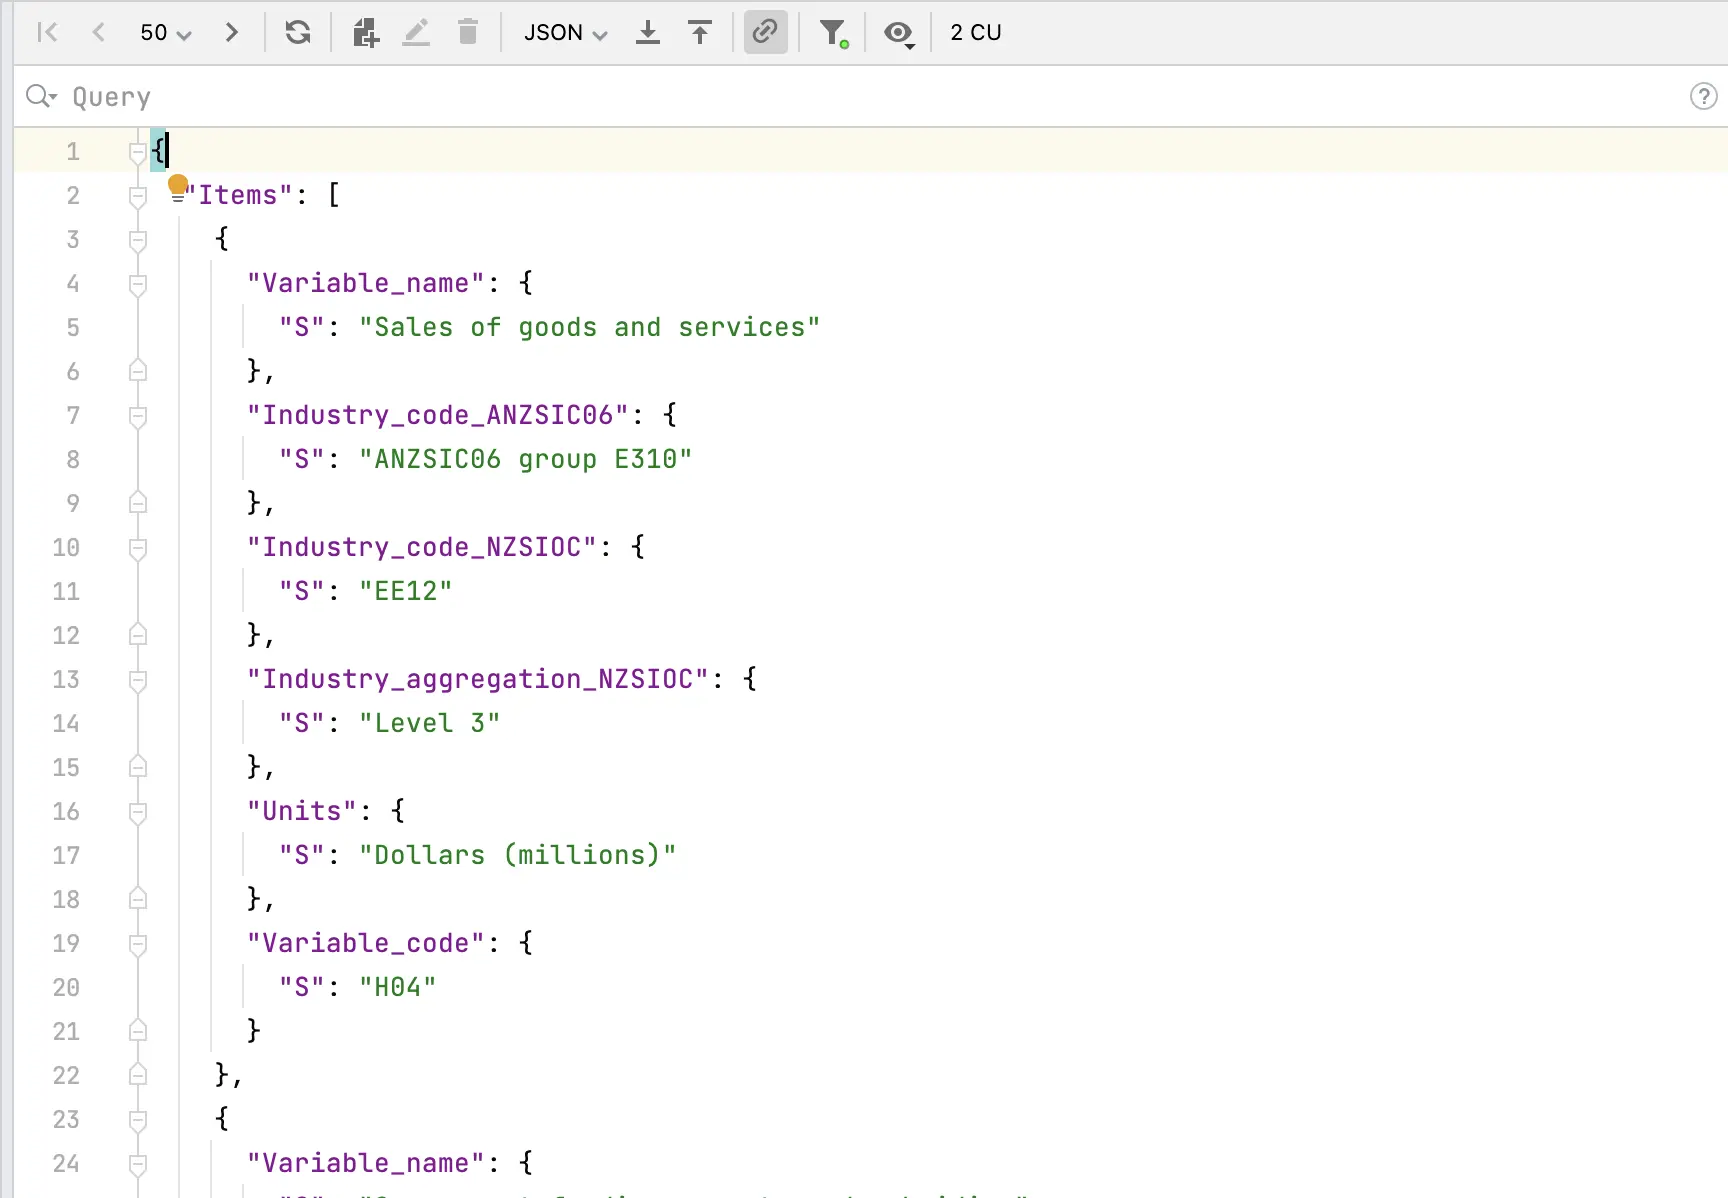
You can browse and edit data in three modes: Table, JSON or DynamoDB JSON.
To switch between these modes, click 
Table

JSON

DynamoDB JSON

Controls on the toolbar
| Icon | Name | Shortcut | Description |
|---|---|---|---|
   | Pagination | Use navigation buttons for switching between pages. You can see the page size between the navigation buttons. You can change it by clicking and selecting the necessary limit. | |
 | Reload Page | ⌘ R | Refresh data |
 | Add New Row | ⌘ N | Add new row |
 | Delete Row | ⌘ ⌫ | Delete row |
 | Revert selected changes | ⌥ ⌘ Z | Revert selected changes |
 | Preview changes | Preview changes | |
 | Submit changes | ⌘ ⏎ | Submit changes |
 | Add New Item | ⌘ N | Open Add new item dialog. |
 | Update Item | ⌘ B | Open Update item dialog. |
 | Delete Item | ⌦ | Open Confirm delete dialog. |
| Data Extractors | Select an output format for your data. When you copy table row to clipboard it will be copied in this format. | ||
 | Export Data | Save data to clipboard or file. | |
 | Import Data | Import data from file or copy table. | |
 | Synchronize Request Body | Enable or disable updating request body accordingly to pagination, or filtering with query. | |
 | Filter attributes | Show/Hide attributes | |
 | View as | Switch between Table, JSON or DynamoDB JSON modes. |